The world we live has a lot of transformation. Anything in the world can have transformation. In the math world transformation is an important core of all concepts. Transformation can be a form of a "In-Out" which put a "In" value and the an "Out" value. It uses a algebraic function y= f(x). F represents the x to the output of y. For this project, you can chose an interest of anything in the world and finding the mathematical transformation that relates to your interest. You will experiment and collect data about your interest by searching the internet, surveying the class, or testing it out yourself. After collecting all your data, you can graph them on x and y scatter plot to figure out if it is a linear or non linear growth.
I enjoy dirt biking so I did my Mathematical transformation on an experiment of if you were to pull the throttle for a certain amount of time for x value, and the y value is how far the bike goes until it comes to a complete stop.
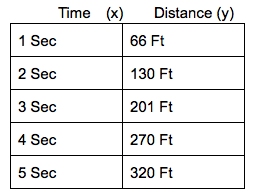
My In and Out Table shows how many seconds (x) I pull the throttle for on my dirtbike and then the out shows how far the bike goes until it comes to a complete stop. This Graph shows that it is a linear relationship because it is in a straight line.
I enjoy dirt biking so I did my Mathematical transformation on an experiment of if you were to pull the throttle for a certain amount of time for x value, and the y value is how far the bike goes until it comes to a complete stop.
My In and Out Table shows how many seconds (x) I pull the throttle for on my dirtbike and then the out shows how far the bike goes until it comes to a complete stop. This Graph shows that it is a linear relationship because it is in a straight line.
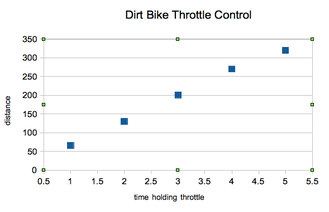
In the first graph you can see the blue squares and if you were to put a straight edge from the first bottom to the top one. All the blue squares will be connected in a straight line. (Linear)
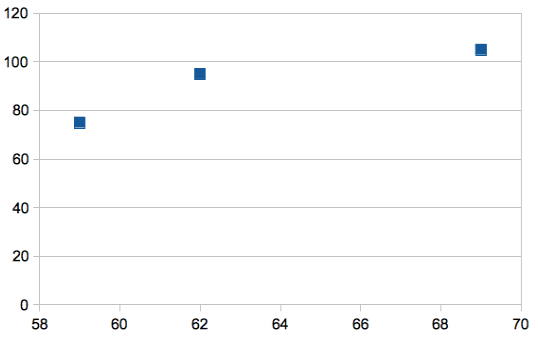
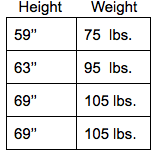
For the second graph you can see the 3 blue dots look scrambled and if you were to put a straight edge from the first blue square to the last blue square, the one in the middle would not meet up with the line.(Non-Linear)
For the second graph you can see the 3 blue dots look scrambled and if you were to put a straight edge from the first blue square to the last blue square, the one in the middle would not meet up with the line.(Non-Linear)

I chose to this type of experiment because motocross is close to me and I enjoy riding my bike so any project that I can do with my bike I do. In the beginning of the project I planned to make a video instructions showing and explaining how I collected my dirt bike data but what I didn't realize was by the time I got home from school, it was almost dark out and there was ant enough time. I wish could of planned that out better because I wasn't able to do a video but I did craft a piece of scrap wood into a silohoutt of a dirt bike rider doing a trick. I enjoyed being able to do this project as a individual and having no limitations for what we could choose to do our experiment on. I used the habit look for patterns in the my motorcycle experiment and finding a pattern. I think I could of used the habit collaborate and listen a little more for the height to weight experiment because everyone did not know exactly what there weight was and I would just take the first number that they would say, not what they actually knew for a fact.
